Data of AIDS cases in Florida from 2012 to 2017
Item
Title
Data of AIDS cases in Florida from 2012 to 2017
Description
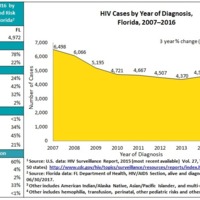
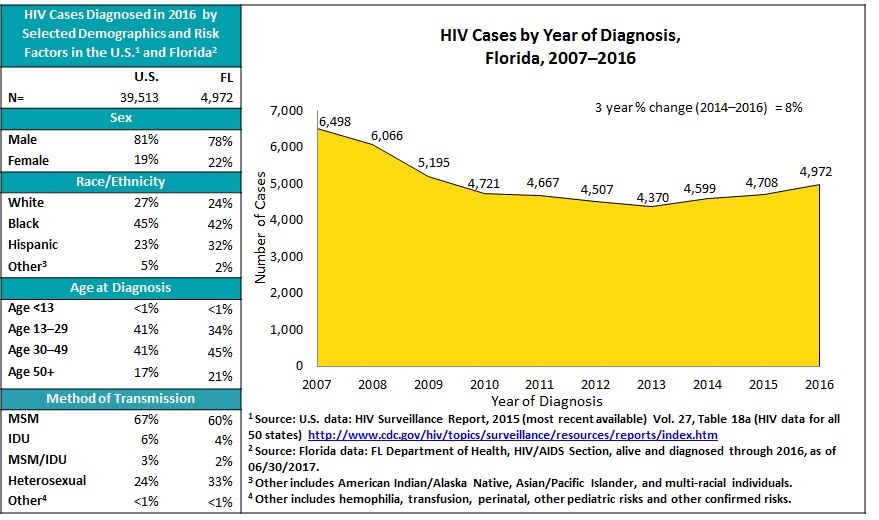
.Figure 1 (below) depicts a summary of newly diagnosed cases
Subject
known to be positive forHIV; Top five states (in number HIV positive), 2004-2006
HIV/AIDS cases as a percent
Total known to be HIV positive of total custody population
Jurisdiction 2004 2005 2006 2004 2005 2006
New York 4,500 4,440 4,000 7.0 7.0 6.3
Florida 3,250 3,396 3,412 3.9 3.9 4.1
Texas 2,405 2,400 2,693 1.7 1.7 1.9
California 1,212 1,249 1,155 0.7 0.7 0.7
Georgia 1,109 1,042 944 2.2 2.1 1.8
Rest of the U.S. 10,460 10,149 9,776 N/A* N/A* N/A*
Total U.S. 22,936 22,676 21,980 1.8 1.7 1.7
* Because these numbers are based on each individual state’s custody population, not
enough data were given to find the percentages.
Source: U.S. Bureau of Justice Statistics See all items with this value
Creator
HIV Data Center
Source
FloridaHealth Across the State
Contributor
of HIV Infection from the last five years, as of June 30th, 2017. Summary health data are stored in Florida Community Health Assessment Resource Tool Set (Florida CHARTS), the Florida Department of Health’s (FL DOH) database used to track the health status of the state